How to tell if your PC needs more RAM
Read Task Manager correctly, tell a real memory shortage from a disk or CPU bottleneck, and check what memory your machine accepts before you buy any.
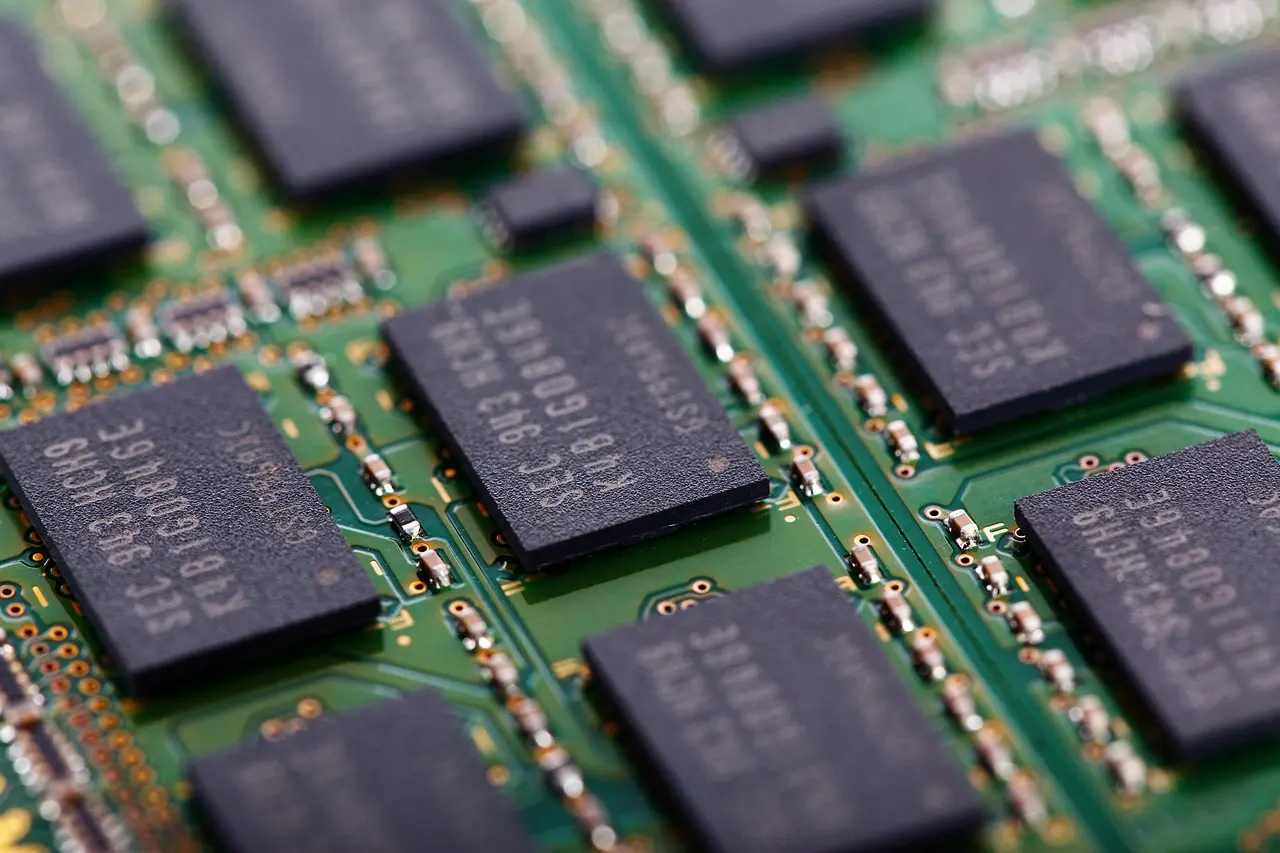
Your PC needs more RAM when the memory available to programs drops toward zero during the work that actually feels slow, and the machine starts fetching pages back off the disk to keep going. A high memory percentage in Task Manager is not that signal, and a large “Committed” number is not either. This article covers what those figures really measure, what a hard page fault is, how to record evidence across the workload that hurts, how to separate a memory shortage from a disk or CPU problem, and how to find out what memory your machine physically accepts before you spend anything. Before any of that, one hardware fact can settle the question outright: laptops that list LPDDR5 or LPDDR5X memory have it soldered to the board, so there is no upgrade to make and the real decision becomes whether to replace the whole machine.
Why a high “In use” figure proves nothing
Windows fills RAM on purpose. Memory sitting empty does no work, so the memory manager keeps recently read file data and preloaded application pages resident on the standby list. Those pages hold useful data and are also discardable the instant something else needs the space, with no disk write required first.
Microsoft’s own API documentation settles this. The available physical memory value returned by MEMORYSTATUSEX is defined as “the amount of physical memory that can be immediately reused without having to write its contents to disk first. It is the sum of the size of the standby, free, and zero lists.” Cached memory counts as available. So a machine showing a large “In use” bar with a healthy standby list is a machine doing its job.
The number that matters is available memory, and the question is whether it collapses while you are doing real work. Tools that “free up” RAM by emptying the standby list make the graph prettier and force the discarded data to be read from disk again the next time it is wanted.
Committed memory is a promise, not occupancy
Task Manager shows two different memory questions on the same pane, and mixing them up causes bad conclusions.
The physical question is whether there is enough RAM right now to hold the pages processes are actively touching. The accounting question is whether Windows has promised more memory than RAM plus the page files can back. When a process commits a region, Windows guarantees it can store whatever gets written there, so it must set aside backing capacity before a single byte is touched.
As Mark Russinovich puts it in Pushing the Limits of Windows: Virtual Memory, “the commit limit is the sum of physical memory and the sizes of the paging files,” and “the amount of committed virtual memory for all the active processes, called the current commit charge, cannot exceed the system commit limit. When the commit limit is reached, virtual allocations that commit memory fail.” Microsoft’s own page file documentation repeats the point and adds the consequence: if commit charge reaches the commit limit, “this condition can cause freezing, crashing, and other malfunctions.”
Two things follow. Commit charge routinely exceeds the RAM actually occupied, because it counts promises. And not everything counts toward it: memory that represents a file on disk does not, since Windows can always re-read it from the file. Private memory such as heaps, and pagefile-backed sections, are what charge commit.
On a test machine measured for this article, committed memory read 74.75 GB against a commit limit of 145.8 GB, while roughly 50 GB of physical RAM was actually in use. Neither number is wrong. They are not the same measurement.
Hard page faults are normal, and there is no magic number
A page fault is a control transfer, not an error. A soft fault is resolved from memory: the page was on the standby or modified list, or already in another process’s working set, and the memory manager just remaps it. A hard fault requires a read from disk, and that read may be part of a DLL being demand-paged in for the first time, a memory-mapped data file, or the page file. Only the last of those is a shortage symptom.
Microsoft is explicit about this: “Hard page faults are a standard function of the operating system,” generated when parts of image files, memory-mapped files, or a page file are read, and “these faults might or might not be related to a page file or to a low-memory condition.”
Microsoft publishes no faults-per-second threshold that means “buy RAM.” What it does publish is arithmetic for the cost: “A system that has a sustained 100 hard page faults per second experiences 400 KB per second disk transfers,” with the note that no performance counter tells you which disk resolved them. Any single cutoff you read in a forum post is calibrated for somebody else’s storage and workload.
Modern Windows also moved the goalposts. Since the first release of Windows 10, cold pages get compressed and kept in RAM before anything is written out. Windows kernel engineer Mehmet Iyigun described the design as keeping memory resident and compressed, “making hard page faults a more rare occurrence.” Three consequences are worth knowing: the System process legitimately holds the compression store, hard fault rates run lower than old rules of thumb assumed, and real memory pressure can show up as unexplained CPU cost before it shows up as paging.
Record the evidence across the work that hurts
A glance at Task Manager while the machine feels fine proves nothing, and single-second samples swing hard. On the test machine, \Memory\Pages/sec moved from 0 to 105 between two consecutive one-second samples. Run a recording that overlaps the stall.
Open PowerShell and collect five minutes of samples while you do the thing that drags:
Get-Counter -Counter @(
  '\Memory\Available MBytes',
  '\Memory\Committed Bytes',
  '\Memory\Commit Limit',
  '\Memory\Modified Page List Bytes',
  '\Memory\Page Reads/sec',
  '\Paging File(_Total)\% Usage',
  '\LogicalDisk(_Total)\Avg. Disk sec/Read',
  '\Processor Information(_Total)\% Idle Time'
) -SampleInterval 1 -MaxSamples 300
Then look at what the numbers did during the seconds the machine stalled, not at their averages. Microsoft’s page file guidance gives a three-condition test that beats any percentage: consider adding RAM or extending the page file only when all three are true at once, that more available physical memory is required, that the modified page list holds a significant amount of memory, and that the existing page files are fairly full. The same page states that 100 percent page file usage “doesn’t indicate a performance problem as long as the system commit limit isn’t reached.”
That is also why sizing a page file as a multiple of RAM is pointless. Russinovich is blunt about the popular formulas: “Almost all the suggestions are based on multiplying RAM size by some factor, with common values being 1.2, 1.5 and 2,” and he calls them useless. His method is to run your real workload, read the peak commit charge, and set the page file minimum to that value minus installed RAM. Microsoft’s guidance agrees that sizing follows peak commit charge and crash dump requirements and “can’t be generalized.” Deleting the page file lowers your commit ceiling and removes the crash dump path.
Per-process memory columns in different tools measure different things and are not comparable with each other, and a Chromium browser spreads one app across many processes, so a single row understates it badly. The browser’s own task manager is the honest view there.
When the real bottleneck is the disk or the CPU
Memory shortage disguises itself as a disk problem. Trimmed working sets come back through disk I/O, that I/O queues behind everything else, and the stall gets measured on the disk even though the cause is memory. Microsoft describes the same loop in its Remote Desktop tuning guidance: page faults from squeezed sessions “eventually overwhelm the I/O subsystem,” and giving each session more memory reduces the overall fault rate.
Separating the two is a matter of whether the counters move together. If disk latency is high while paging counters sit near zero, the disk is the problem on its own merits, which can mean a background indexer, an overwhelmed hard drive, or a drive going bad. If disk latency spikes track page read spikes while available memory scrapes the floor, RAM is the cause and the disk is the victim. And if idle time is on the floor with available memory comfortable and paging quiet, you have a CPU-bound workload that more RAM will not touch.
Microsoft publishes healthy and critical bands for these counters in its Troubleshoot performance problems in Windows guide. That guide is written for Windows Server troubleshooting, so treat the numbers as calibration for reading a trace, not as consumer pass or fail marks.
| Counter | Microsoft’s healthy band | Microsoft’s critical band |
|---|---|---|
\Memory\Available MBytes | above 10% or at least 4 GB free | below 1% or under 500 MB |
\Memory\% Committed Bytes In Use | 0 to 50% | 80 to 100% |
\LogicalDisk(*)\Avg. Disk sec/Read | under 15 ms | over 50 ms |
\Processor Information(*)\% Privileged Time | under 30% | over 50% |
The same guide adds the sanity check that keeps you from chasing noise: short spikes are acceptable, and it is worth investigating when a reading holds for over a minute. Sustained privileged time points at drivers, filter drivers, or a scanner, and not at your application.
Before buying hardware, clear the ordinary causes first. Our checklist for speeding up a slow computer covers the startup and background load side, and heavy desktop customization tools keep their own processes resident for as long as they run.
Check what your machine accepts before you buy
Start with the question that can end the project: is the memory replaceable at all? There are three answers now, not two. Sockets, meaning DIMM in desktops and SODIMM in laptops. Removable low-power modules under the JEDEC CAMM2 standard, JESD318, published on December 5, 2023, which covers DDR5 CAMM2 and LPDDR5/5X CAMM2 in one document. Or soldered to the board, which is the case on many thin laptops and on Apple silicon Macs, where the configuration you bought is permanent.
On Windows, two built-in commands answer the rest with no download:
Get-CimInstance Win32_PhysicalMemoryArray |
  Select-Object MaxCapacityEx, MemoryDevices, MemoryErrorCorrection

Get-CimInstance Win32_PhysicalMemory |
  Select-Object DeviceLocator, Capacity, Speed, ConfiguredClockSpeed,
                SMBIOSMemoryType, FormFactor, Manufacturer, PartNumber
MaxCapacityEx is the maximum installable memory in kilobytes and MemoryDevices is the slot count, both read out of the firmware’s SMBIOS tables. In Win32_PhysicalMemory, FormFactor 8 means DIMM and 12 means SODIMM. Read SMBIOSMemoryType, not MemoryType: the older enumeration stops at 26 for DDR4 and has no DDR5 value, while the SMBIOS values are 26 for DDR4, 34 for DDR5, and 35 for LPDDR5.
On the test machine, that returned a 256 GB array maximum across 4 slots with no error correction, and four Kingston modules of 32 GB each, part number KF560C36, SMBIOSMemoryType 34, FormFactor 8, running at 4200. Slot count, occupancy, DDR generation, form factor, part number, and running speed, without installing anything.
Four independent gates decide what will work, and the tightest one wins: the CPU memory controller, the board or chassis with its slot count and per-slot maximum, the firmware table, and the Windows edition ceiling. That last one is real and enforced. Windows 11 Home caps at 128 GB, Pro and Education reach 2 TB, and Enterprise and Pro for Workstations reach 6 TB. Windows 11’s stated 4 GB minimum is a floor for installing the OS, not a target to build around.
Treat the firmware figure as a claim rather than a measurement, since the SMBIOS tables were written by the machine’s manufacturer. Dell’s upgrade guidance states the hard constraints directly: “Desktop computers support DIMM modules, and laptops support SODIMM,” “System boards are designed to support only one generation of system memory (RAM),” and on some laptops the memory “is integrated into the system board” and cannot be upgraded at all. The model-specific spec page keyed to your service tag or serial is the authority.
Task Manager is not a reliable source for memory hardware details either. Microsoft has a standing KB stating that Task Manager “parses the SMBIOS memory data incorrectly,” and pointing to other sources such as Resource Monitor for hardware-reserved memory. Since the June 25, 2024 update KB5039302, Task Manager labels DDR speed in MT/s, so older screenshots showing MHz predate the fix.
On a Mac
Apple gives you a pressure indicator, not a usage percentage. In Activity Monitor, green means the computer is using all of its RAM efficiently, yellow means it might eventually need more, and red means it needs more RAM. To check upgradability, hold Option, open the Apple menu, choose System Information, then Hardware, Memory, and the Memory Slots pane. If that pane does not appear, the Mac does not support upgradeable memory.
Capacity and speed solve different problems
If the machine is paging under load, capacity is the fix and the kit’s rated speed is beside the point. If it is not paging, extra capacity buys nothing measurable and speed or channel configuration is the only lever left. Buying a faster kit to cure a shortage, or more gigabytes to cure a CPU-bound workload, is how money gets spent for no change.
Rated speed on the box is also not the speed you get by default. Kingston’s datasheet for the modules in the test machine says each was tested to run at DDR5-6000 at 36-38-38 timings, but “The SPDs are programmed to JEDEC standard latency DDR5-4800 timing of 40-39-39 at 1.1V.” Without XMP or EXPO enabled in firmware, a module runs its JEDEC default. Those four modules reported 4200 MT/s with all four slots filled, below both the rated figure and the JEDEC default, which is what populating every slot can do to a memory controller.
The low-risk path is one matched kit that reaches your target capacity in the fewest modules. Adding a single stick to an existing pair invites mismatched timings and a broken channel layout.
Integrated graphics complicate the arithmetic further. On a machine with an iGPU, part of the installed RAM is carved out for video memory before applications see any of it, so the number Windows reports as installed is not the number your programs can reach.
Start here
Run the counter recording above while you reproduce the slowdown, and look only at the seconds where it hurt. If available memory hits the floor and page reads spike with disk latency at the same moment, that is your evidence. If disk latency is high with paging flat, or idle time is on the floor with memory comfortable, the money belongs somewhere other than memory.
Then run the two CIM commands before you open a shopping tab, check whether the machine is socketed, CAMM2, or soldered, and confirm the model-specific maximum against the manufacturer’s page for your exact service tag. If nothing needs replacing, trimming what runs in the background is the cheaper fix, and a lighter set of free Windows apps can take some of that load off.
Common questions
Is 8 GB of RAM enough for Windows 11 in 2026?
It is tight. Windows 11 can use roughly 4 to 6 GB at idle on an 8 GB machine, which leaves little for applications, and Microsoft has acknowledged that 8 GB systems can feel slow. 16 GB gives comfortable headroom for everyday multitasking and a browser with many tabs.
How do I tell whether my laptop’s memory is upgradable or soldered?
Check the spec sheet or service manual for the memory type: LPDDR5 and LPDDR5X are always soldered to the board and cannot be changed, while SODIMM modules sit in removable slots. On Windows, Get-CimInstance Win32_PhysicalMemory reports the form factor, where 12 means a SODIMM slot.
Does a high memory percentage in Task Manager mean I need more RAM?
No. Windows deliberately fills unused RAM with cached file and application data that still counts as available the instant something needs it. The real signal is available memory collapsing while page reads and disk latency spike during the work that actually feels slow, not a high “In use” figure.
Will faster RAM make my PC quicker?
Only when you are not short on capacity. If the machine is paging under load, adding capacity is the fix and the kit’s rated speed barely matters, and higher advertised speeds need XMP or EXPO enabled in firmware to reach them at all.